From Debugging to UI Design: Flutter Tools Professional Developers Use
In modern cross-platform development, Flutter has earned a reputation for enabling fast, expressive, and visually consistent applications. Professional developers rely on a sophisticated ecosystem of tools to move efficiently from debugging complex logic to crafting polished user interfaces. Their workflow is rarely linear; rather, it involves constant switching between diagnostic utilities, performance analyzers, design tools, and automation frameworks that streamline every stage of development.
TLDR: Professional Flutter developers rely on a powerful set of tools that support debugging, performance optimization, and UI design. From Flutter DevTools and IDE integrations to design handoff platforms and automated testing frameworks, each tool plays a specific role in delivering high-quality apps. Mastery of these tools improves workflow efficiency, app stability, and visual polish. A successful Flutter project depends not only on coding skills but also on strategic tool usage.
Integrated Development Environments (IDEs)
Table of Contents
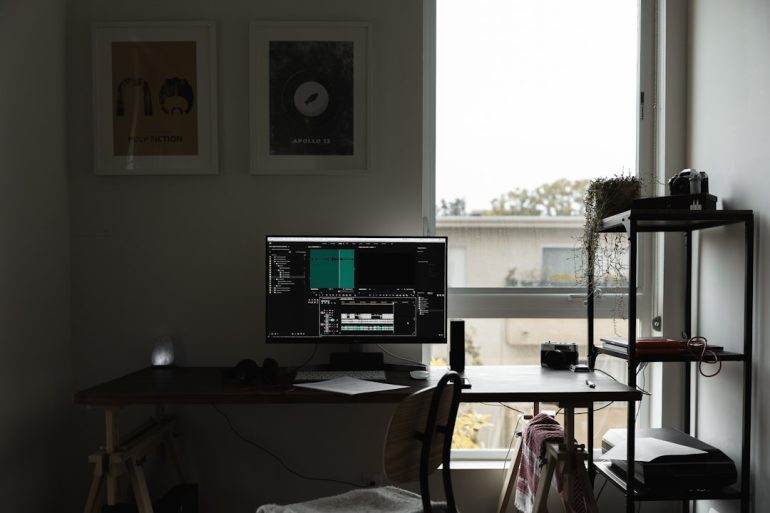
Most professional Flutter developers begin with a robust Integrated Development Environment such as Visual Studio Code or Android Studio. These IDEs offer Flutter and Dart plugins that significantly enhance productivity.
Key features professionals rely on include:
- Hot Reload and Hot Restart for instant code reflection
- Intelligent code completion powered by Dart analysis
- Inline error detection and quick fixes
- Integrated debugging panels
Hot Reload, in particular, is central to Flutter’s appeal. Developers can tweak UI components, change styling, or adjust business logic and see the updates almost instantly without restarting the application. This capability dramatically shortens feedback cycles and encourages experimentation during UI design.
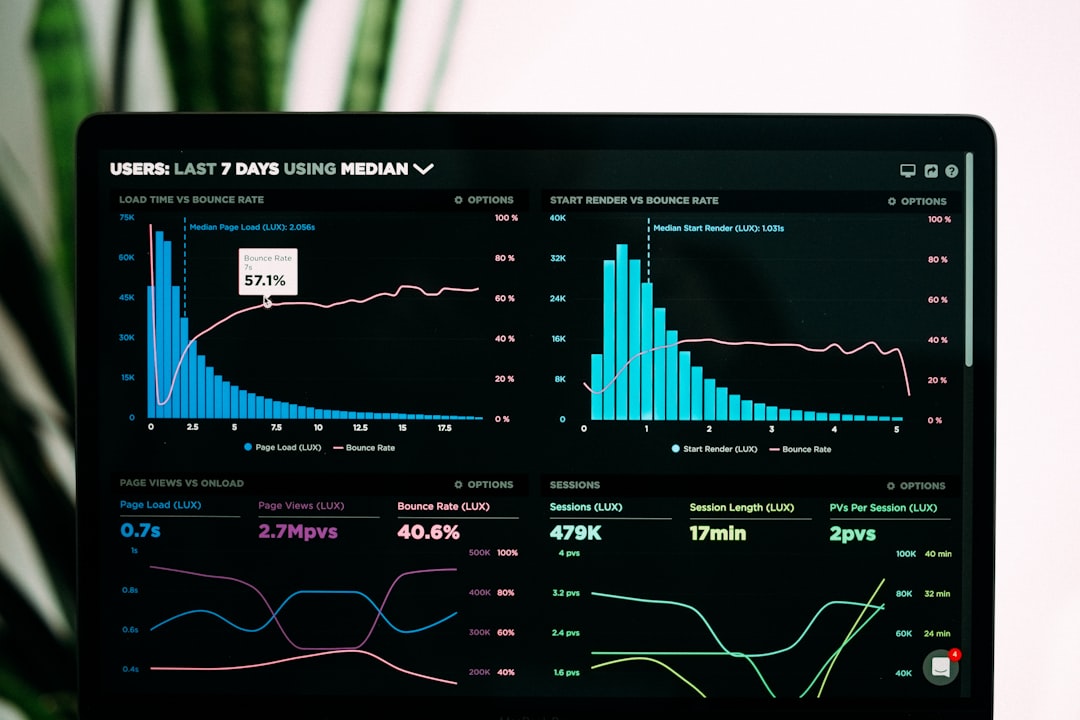
Flutter DevTools: The Diagnostic Powerhouse
When applications scale, debugging requires more than console prints. Flutter DevTools provides a suite of profiling and inspection tools accessible via browser or IDE integration.
Professional developers use DevTools for:
- Widget Inspector to analyze UI hierarchy
- Performance profiling via frame charts
- Memory analysis to detect leaks
- Network request inspection
- Debugging layout constraints
The Widget Inspector allows developers to select a UI element and instantly view its properties and layout constraints. This is particularly important in Flutter, where improper nesting or misconfigured constraints can lead to overflow errors. Instead of guessing, professionals visualize the structure directly and make calculated adjustments.
Performance profiling tools help teams examine frame rendering times. Maintaining a steady 60 FPS (or higher) is essential for smooth animations and transitions. DevTools provides flame charts that expose expensive rendering operations and rebuilds, enabling targeted optimizations.
Logging and Error Monitoring
Beyond local debugging, production-level applications require continuous monitoring. Professionals integrate services such as Firebase Crashlytics, Sentry, or similar error-tracking platforms.
These tools provide:
- Real-time crash reports
- Stack trace analysis
- User session insights
- Device and OS diagnostics
Instead of waiting for user complaints, teams receive proactive alerts about failures. Detailed logs allow engineers to reproduce issues quickly and push patches efficiently. This level of observation is crucial for maintaining stability as apps grow and reach diverse audiences.
State Management Debugging Tools
Flutter applications frequently rely on state management solutions like Provider, Riverpod, Bloc, or Redux. Professionals often integrate logging extensions and developer panels to visualize state transitions.
For example:
- Bloc offers transition logging
- Riverpod includes provider inspection tools
- Redux supports time-travel debugging
These debugging capabilities help identify unexpected rebuilds or inconsistent data flows. Advanced projects demand predictable state updates, especially in enterprise-grade applications.
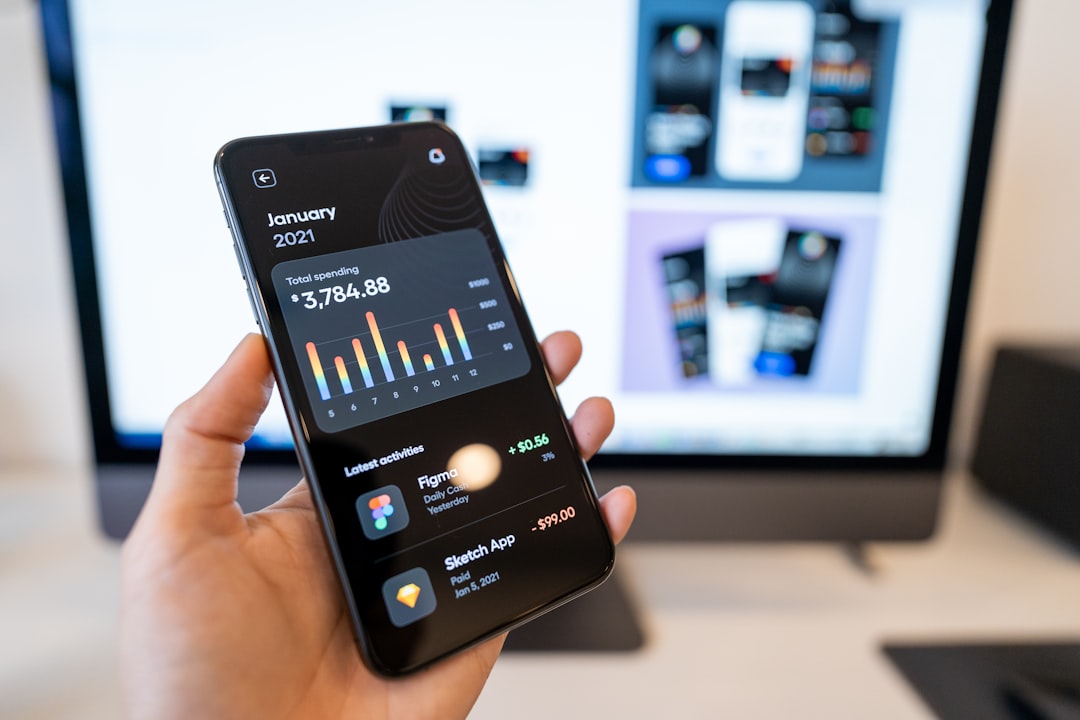
Design Collaboration and Handoff Tools
Moving from debugging to UI design often requires collaboration with designers. Professionals depend on tools like Figma, Adobe XD, and Zeplin for structured handoffs.
Design tools support:
- Pixel-precise measurements
- Color style extraction
- Typography inspection
- Asset export in multiple resolutions
Flutter’s declarative UI nature aligns well with design systems. Developers commonly create reusable widgets that mirror design components such as buttons, cards, or navigation patterns. By matching design tokens (spacing, font sizes, and color palettes), they maintain consistency across the application.
UI Prototyping and Animation Tools
Professional-grade apps often incorporate advanced animations. Flutter provides powerful built-in animation frameworks, but developers frequently prototype animations using:
- Rive for interactive vector animations
- Lottie for JSON-based motion graphics
- FlutterFlow for rapid prototyping
These tools allow designers and developers to collaborate closely on motion design. Smooth micro-interactions improve user engagement, and tools like Rive provide real-time state-driven animations that integrate seamlessly with Flutter apps.
Layout Debugging Techniques
Flutter’s flexible layout model is powerful but can present constraints-related challenges. Professionals activate built-in visual debugging options such as:
- Debug Paint to visualize layout boundaries
- Overflow indicators to detect layout issues
- Constraint highlighting through DevTools
These visual overlays expose padding misalignments and rendering anomalies that are difficult to detect otherwise. Such systematic inspection ensures responsive layouts across varied screen sizes.
Automated Testing Frameworks
No professional development workflow is complete without automated testing. Flutter supports:
- Unit tests for business logic validation
- Widget tests for UI behavior verification
- Integration tests for full user flows
Testing frameworks such as flutter_test and integration_test are integrated directly into the Flutter ecosystem. Professionals often use continuous integration systems to automatically run test suites during every commit. This reduces regression risks and preserves UI stability while features evolve.
Performance Optimization Tools
Performance tuning extends beyond frame analysis. Developers also monitor:
- Shader compilation delays
- Image caching efficiency
- Widget rebuild frequency
- CPU and memory consumption
Using profiling metrics, professionals identify heavy computations that should be moved off the main thread using isolates. They also apply lazy loading strategies and efficient state scoping to prevent unnecessary rebuilds.
Version Control and Collaboration
Tools such as Git, GitHub, or GitLab anchor collaborative development. Pull request workflows ensure code reviews maintain quality standards. Many teams enforce formatting with dart format and static analysis using dart analyze before merging changes.
This structured process guarantees that UI updates, performance tweaks, and debugging fixes do not introduce inconsistencies.
Theme and Design System Management
Professional developers rarely hard-code styling values. Instead, they build centralized ThemeData configurations and reusable component libraries.
Design systems allow:
- Global brand consistency
- Rapid UI scaling
- Simplified dark mode implementation
- Reduced duplication of styling code
By carefully structuring themes and component APIs, teams maintain flexibility without sacrificing maintainability.
Continuous Integration and Deployment (CI/CD)
Automation tools such as Codemagic, Bitrise, and GitHub Actions streamline building, testing, and publishing applications.
CI/CD pipelines typically perform:
- Static code analysis
- Automated testing
- Build generation for Android and iOS
- Artifact deployment to app stores
This automation reduces manual overhead and ensures faster release cycles. Developers can focus on debugging issues and enhancing UI features rather than handling repetitive tasks.
Conclusion
Professional Flutter development is supported by a comprehensive toolkit that spans debugging, profiling, UI design, collaboration, and automation. Mastery of these tools distinguishes seasoned developers from beginners. With DevTools providing insight into performance, design platforms ensuring visual precision, and CI pipelines automating deployment, professionals navigate the entire lifecycle efficiently. Ultimately, success in Flutter development depends as much on strategic tool usage as on technical proficiency.
FAQ
1. What is the most important debugging tool in Flutter?
Flutter DevTools is considered the most comprehensive debugging suite, offering widget inspection, performance profiling, and memory analysis in one interface.
2. Which IDE is best for professional Flutter development?
Both Visual Studio Code and Android Studio are widely used. The choice depends on developer preference and project complexity.
3. How do developers test Flutter applications?
They use unit tests, widget tests, and integration tests supported by Flutter’s built-in testing libraries, often integrated into CI/CD pipelines.
4. What tools help with UI design collaboration?
Figma, Adobe XD, and Zeplin are popular for design handoffs, allowing developers to extract assets, spacing values, and typography specifications.
5. How do developers optimize Flutter app performance?
They profile frame rendering, monitor memory usage, reduce unnecessary rebuilds, and move heavy computations into isolates to keep the UI thread responsive.
6. Is Flutter suitable for enterprise applications?
Yes. With proper use of debugging, monitoring, testing, and performance optimization tools, Flutter can support scalable, enterprise-grade applications.